Monitoring a Synology NAS with SNMP & Grafana
Introduction
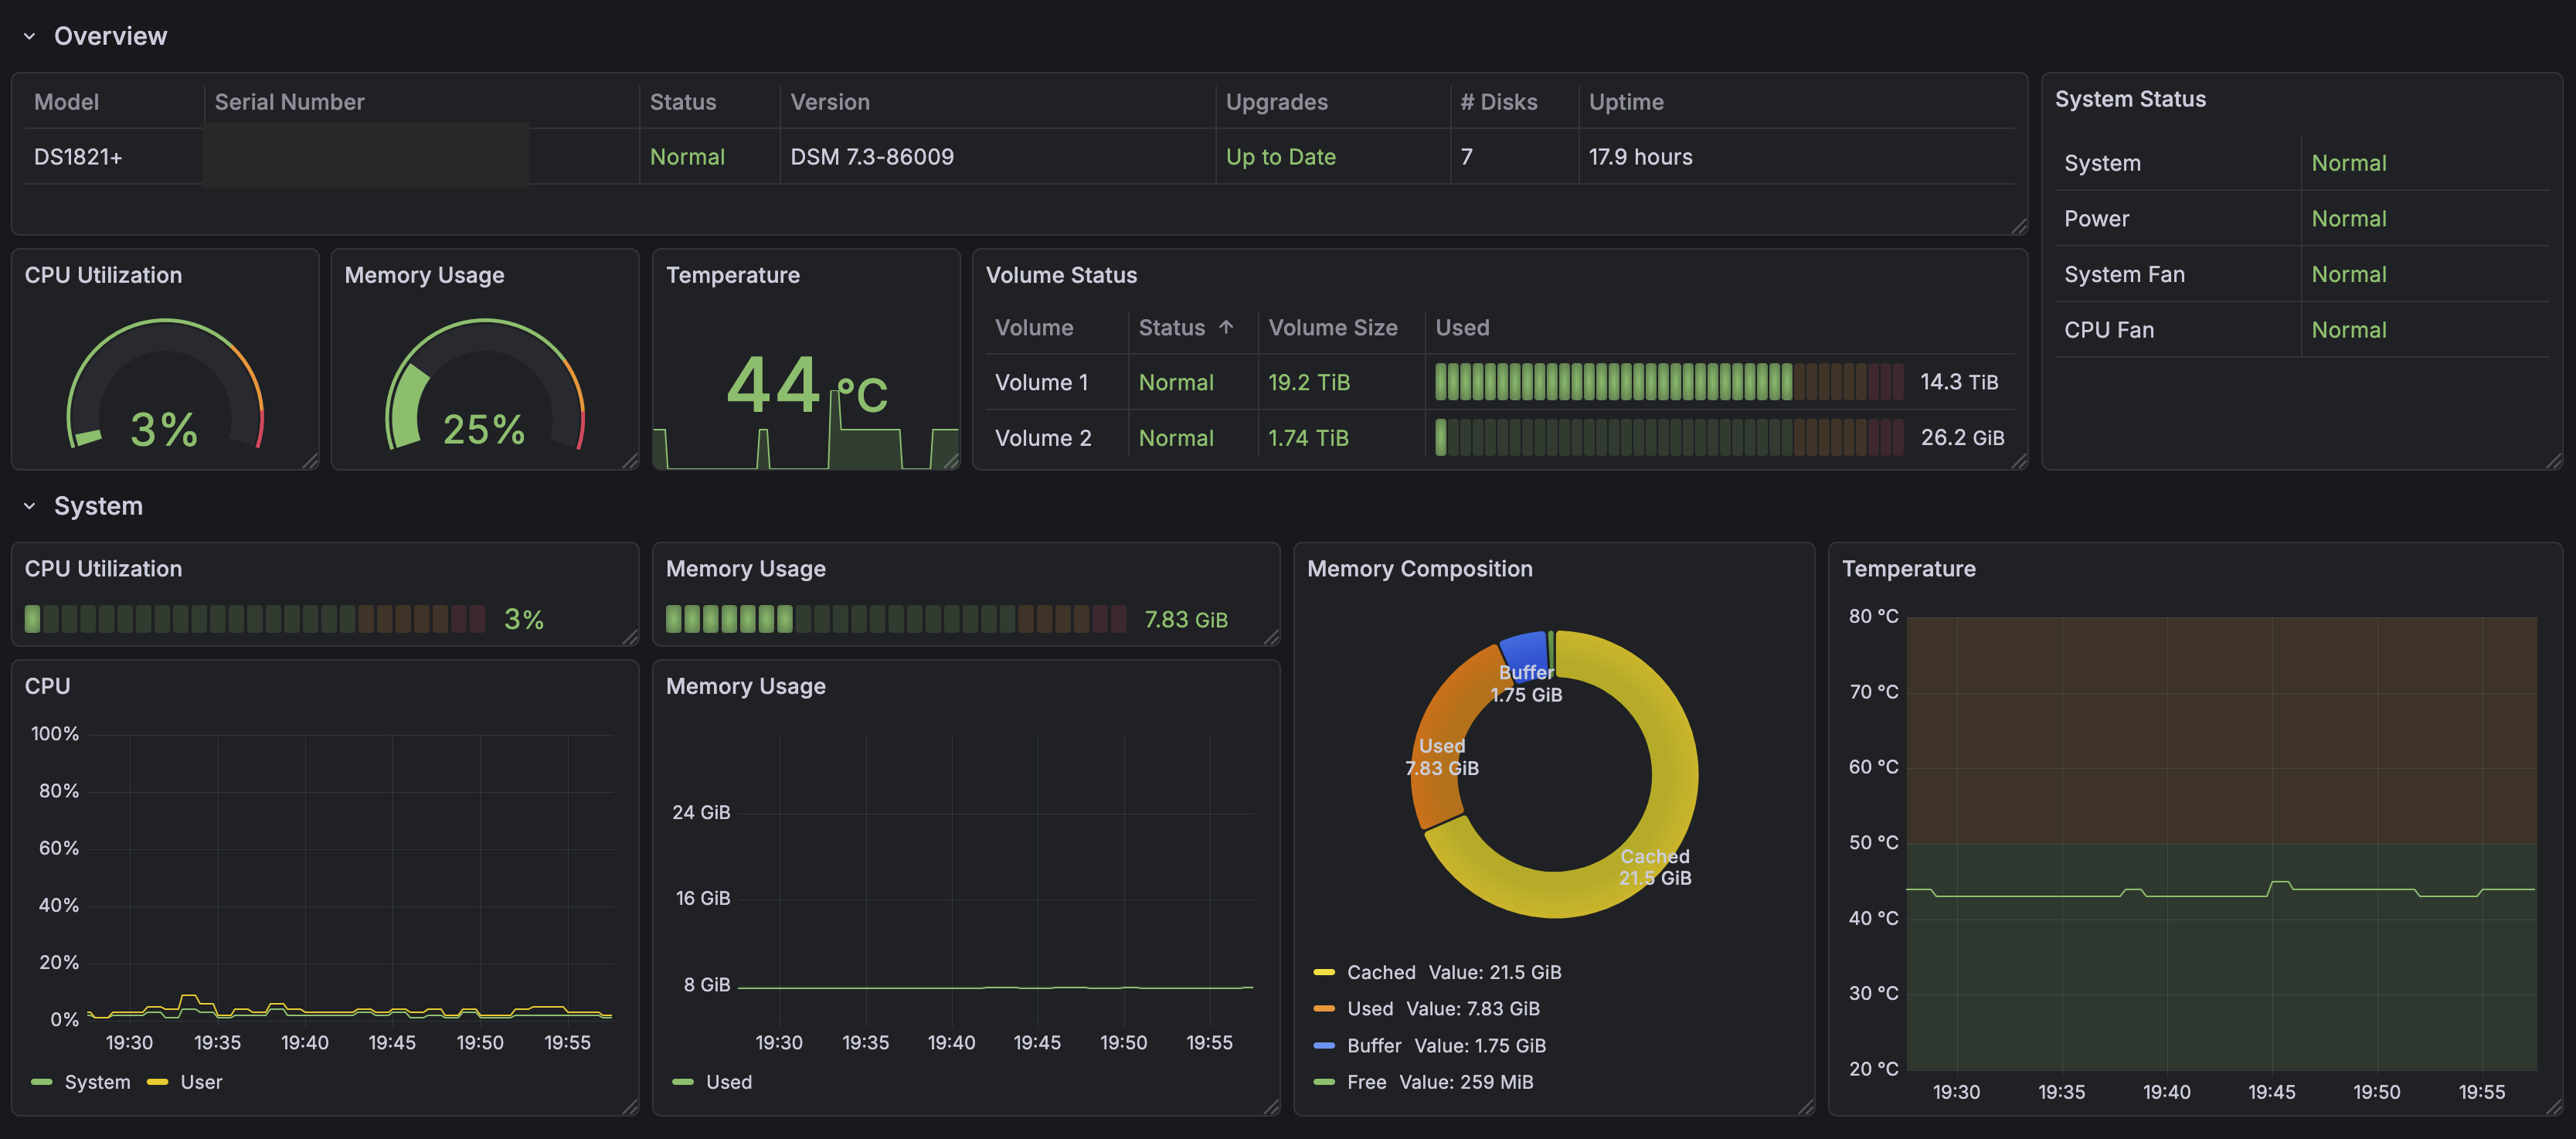
I figured it would be fun and mildly useful to have a Grafana dashboard for monitoring my Synology DS1821+ NAS. After spending a rainy weekend grappling with metrics, I have a dashboard that shows me realtime stats including CPU, memory, disks, volumes, temperatures and network activity.
In this post I'll show you how you can set up your own dashboard.
System overview
The plan is to monitor the NAS using SNMP (Simple Network Management Protocol). The data collected via SNMP will be ingested into Prometheus. Grafana will use Prometheus as a data source, allowing us to create dashboards.
Despite the name, SNMP is anything but simple. Fortunately, the Prometheus SNMP Exporter will do most of the work for us.
+--------------+    +-----------------+     +---------------+    +-------------+
|   Synology   |--->|  SNMP Exporter  |---->|  Prometheus   |--->|   Grafana   |
+--------------+    +-----------------+     +---------------+    +-------------+
Synology SNMP setup
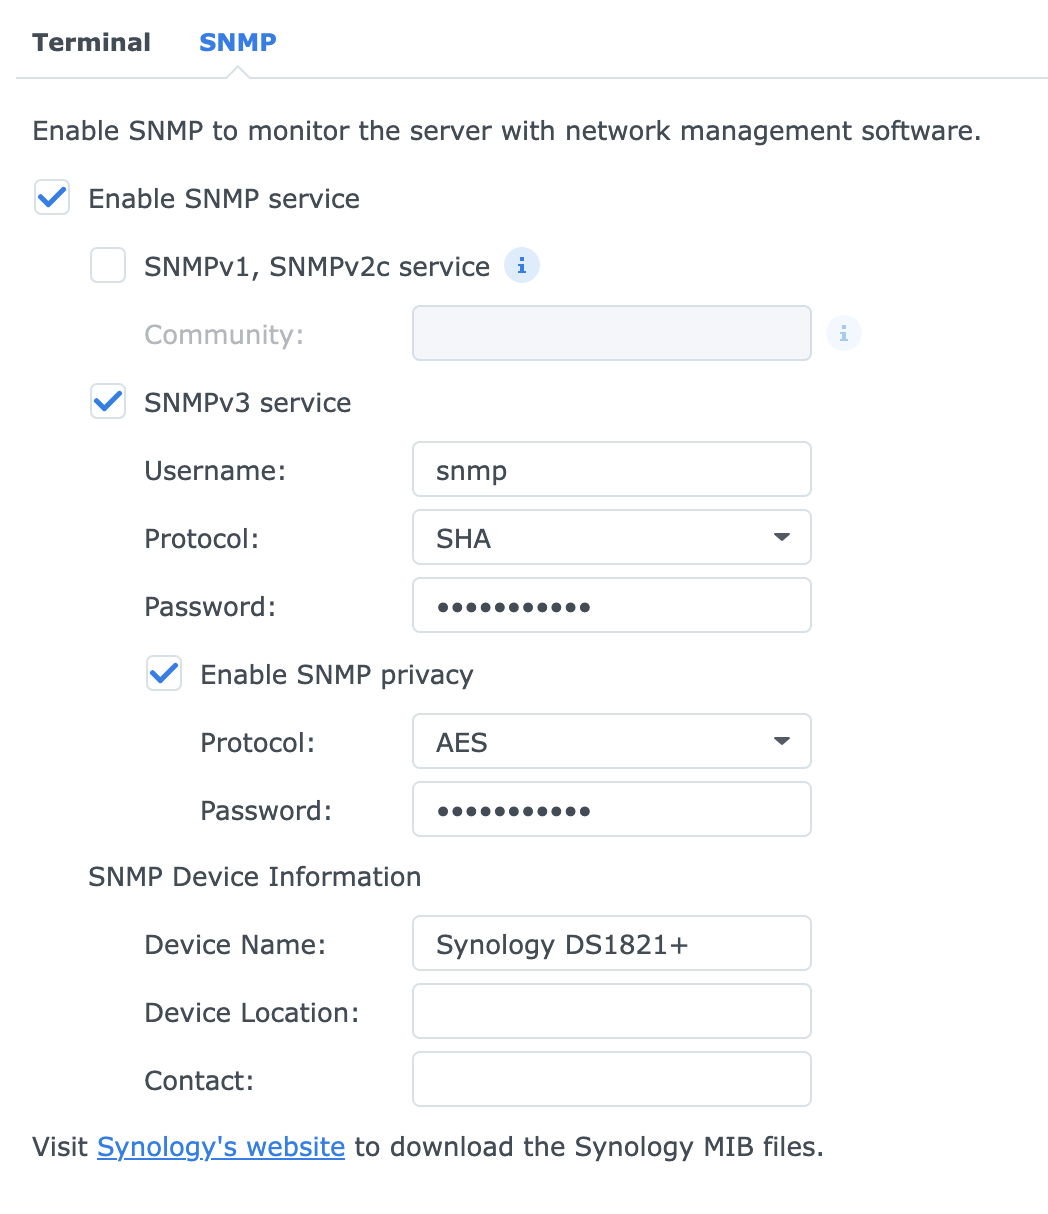
To enable the SNMP service, log in to DSM and navigate to Control Panel > Terminal & SNMP > SNMP.
- Check Enable SNMP service
- Check SNMPv3 service
- Set a username, e.g.
snmp - Choose protocol
SHA - Set a password
- Check Enable SNMP privacy
- Choose protocol
AES - Set a password
- Set a Device Name
SNMP Exporter setup
The SNMP Exporter runs in a Docker container.
The default configuration file (found at /etc/snmp_exporter/snmp.yml in the container) includes most common modules, including the Synology module.
There is no need to download MIB files or generate your own config.
If you do find yourself needing to generate a config from MIB files, you can use the generator tool. I found it didn't run very well on Mac OS and involved some manual tweaking of the Makefile.
We do, however, have to provide a config file with auth information. Set the passwords that you chose in DSM.
// auth.yml

auths:
  synology: # ← This name is important later
    community: public
    security_level: authPriv
    username: snmp
    password: snmpv3-password-from-earlier
    auth_protocol: SHA
    priv_protocol: AES
    priv_password: privacy-password-from-earlier
    version: 3
Use a Docker volume to mount the file inside the container,
and then set the --config.file arg.
This can be specified twice: once for the default config, and once for our auth config.
The files will be overlayed.
// compose.yaml

services:
    snmp-exporter:
        image: prom/snmp-exporter
        container_name: snmp-exporter
        restart: unless-stopped
        volumes:
        - '/path/to/auth.yml:/etc/snmp_exporter/auth.yml'
        ports:
        - '9116:9116'
        command: ["--config.file=/etc/snmp_exporter/snmp.yml", "--config.file=/etc/snmp_exporter/auth.yml"]
Testing snmp-exporter
You can test this right away. Substitute in the IP address of the Docker host and the IP of the NAS, respectively (they will be the same if you're using Container Manager on the NAS itself).
curl 'http://docker_host_ip:9116/snmp?target=synology_nas_ip&auth=synology&module=synology'With some luck, you'll see it spit out a bunch of metrics.
Grafana and Prometheus setup
If you don't already have Grafana and Prometheus, you may want to run these as Docker containers too.
Refer to official the official docs for up-to-date information.
- https://grafana.com/docs/grafana/latest/setup-grafana/installation/docker/
- https://prometheus.io/docs/prometheus/latest/installation/#using-docker
// compose.yaml

services:
    grafana:
        image: grafana/grafana
        container_name: grafana
        restart: unless-stopped
        ports:
            - '3000:3000'
        volumes:
            - '/path/to/data:/var/lib/grafana'

    prometheus:
        image: prom/prometheus
        container_name: prometheus
        restart: unless-stopped
        ports:
            - '9090:9090'
        volumes:
            - '/path/to/config:/etc/prometheus'
            - '/path/to/data:/prometheus'
Grafana data source
In Grafana, add a Prometheus data source using the URL http://prometheus:9090.
Prometheus config
Add a new scrape configuration to Prometheus.
Below is an example prometheus.yml file.
If using the Docker Compose file above, this would be placed inside /path/to/config/.
At a minimum, include the synology module under params.module.
For reasons I cannot explain, not all of the documented Synology MIBs get scraped.
Some are missing, e.g. cpuUtilization. We can get similar metrics from other modules, though.
Synology supports a few natively, including if_mib, ucd_system_stats, ucd_memory, and system.
Again, refer to the snmp-exporter default snmp.yml file for a list of all available modules and associated metrics.
// prometheus.yml

global:
  scrape_interval: 1m

scrape_configs:
  - job_name: 'synology'
    scrape_interval: 1m
    static_configs:
      - targets: ['192.168.1.XX'] # ← The IP address of your Synology NAS
        labels:
          # Add custom labels to all metrics scraped by this job, e.g.:
          device: 'ds1821'
    metrics_path: /snmp
    params:
      # Add the synology module, along with any standard modules that DSM supports
      module: [synology, if_mib, ucd_system_stats, ucd_memory, system]
      # This is the name of the auth block from auth.yml above.
      auth: [synology]
    relabel_configs:
      - source_labels: [__address__]
        target_label: __param_target
      - source_labels: [__param_target]
        target_label: instance
      - target_label: __address__
        # This must be the host:port of SNMP Exporter.
        # Assuming it's running on the same Docker network as
        # Prometheus, we can access it via its container name.
        replacement: snmp-exporter:9116
Restart Promtheus, and it should start scraping metrics from the NAS. Visit the Prometheus web interface (port 9090) and navigate to Status > Target health to check.
And with that, you're ready to build some dashboards!
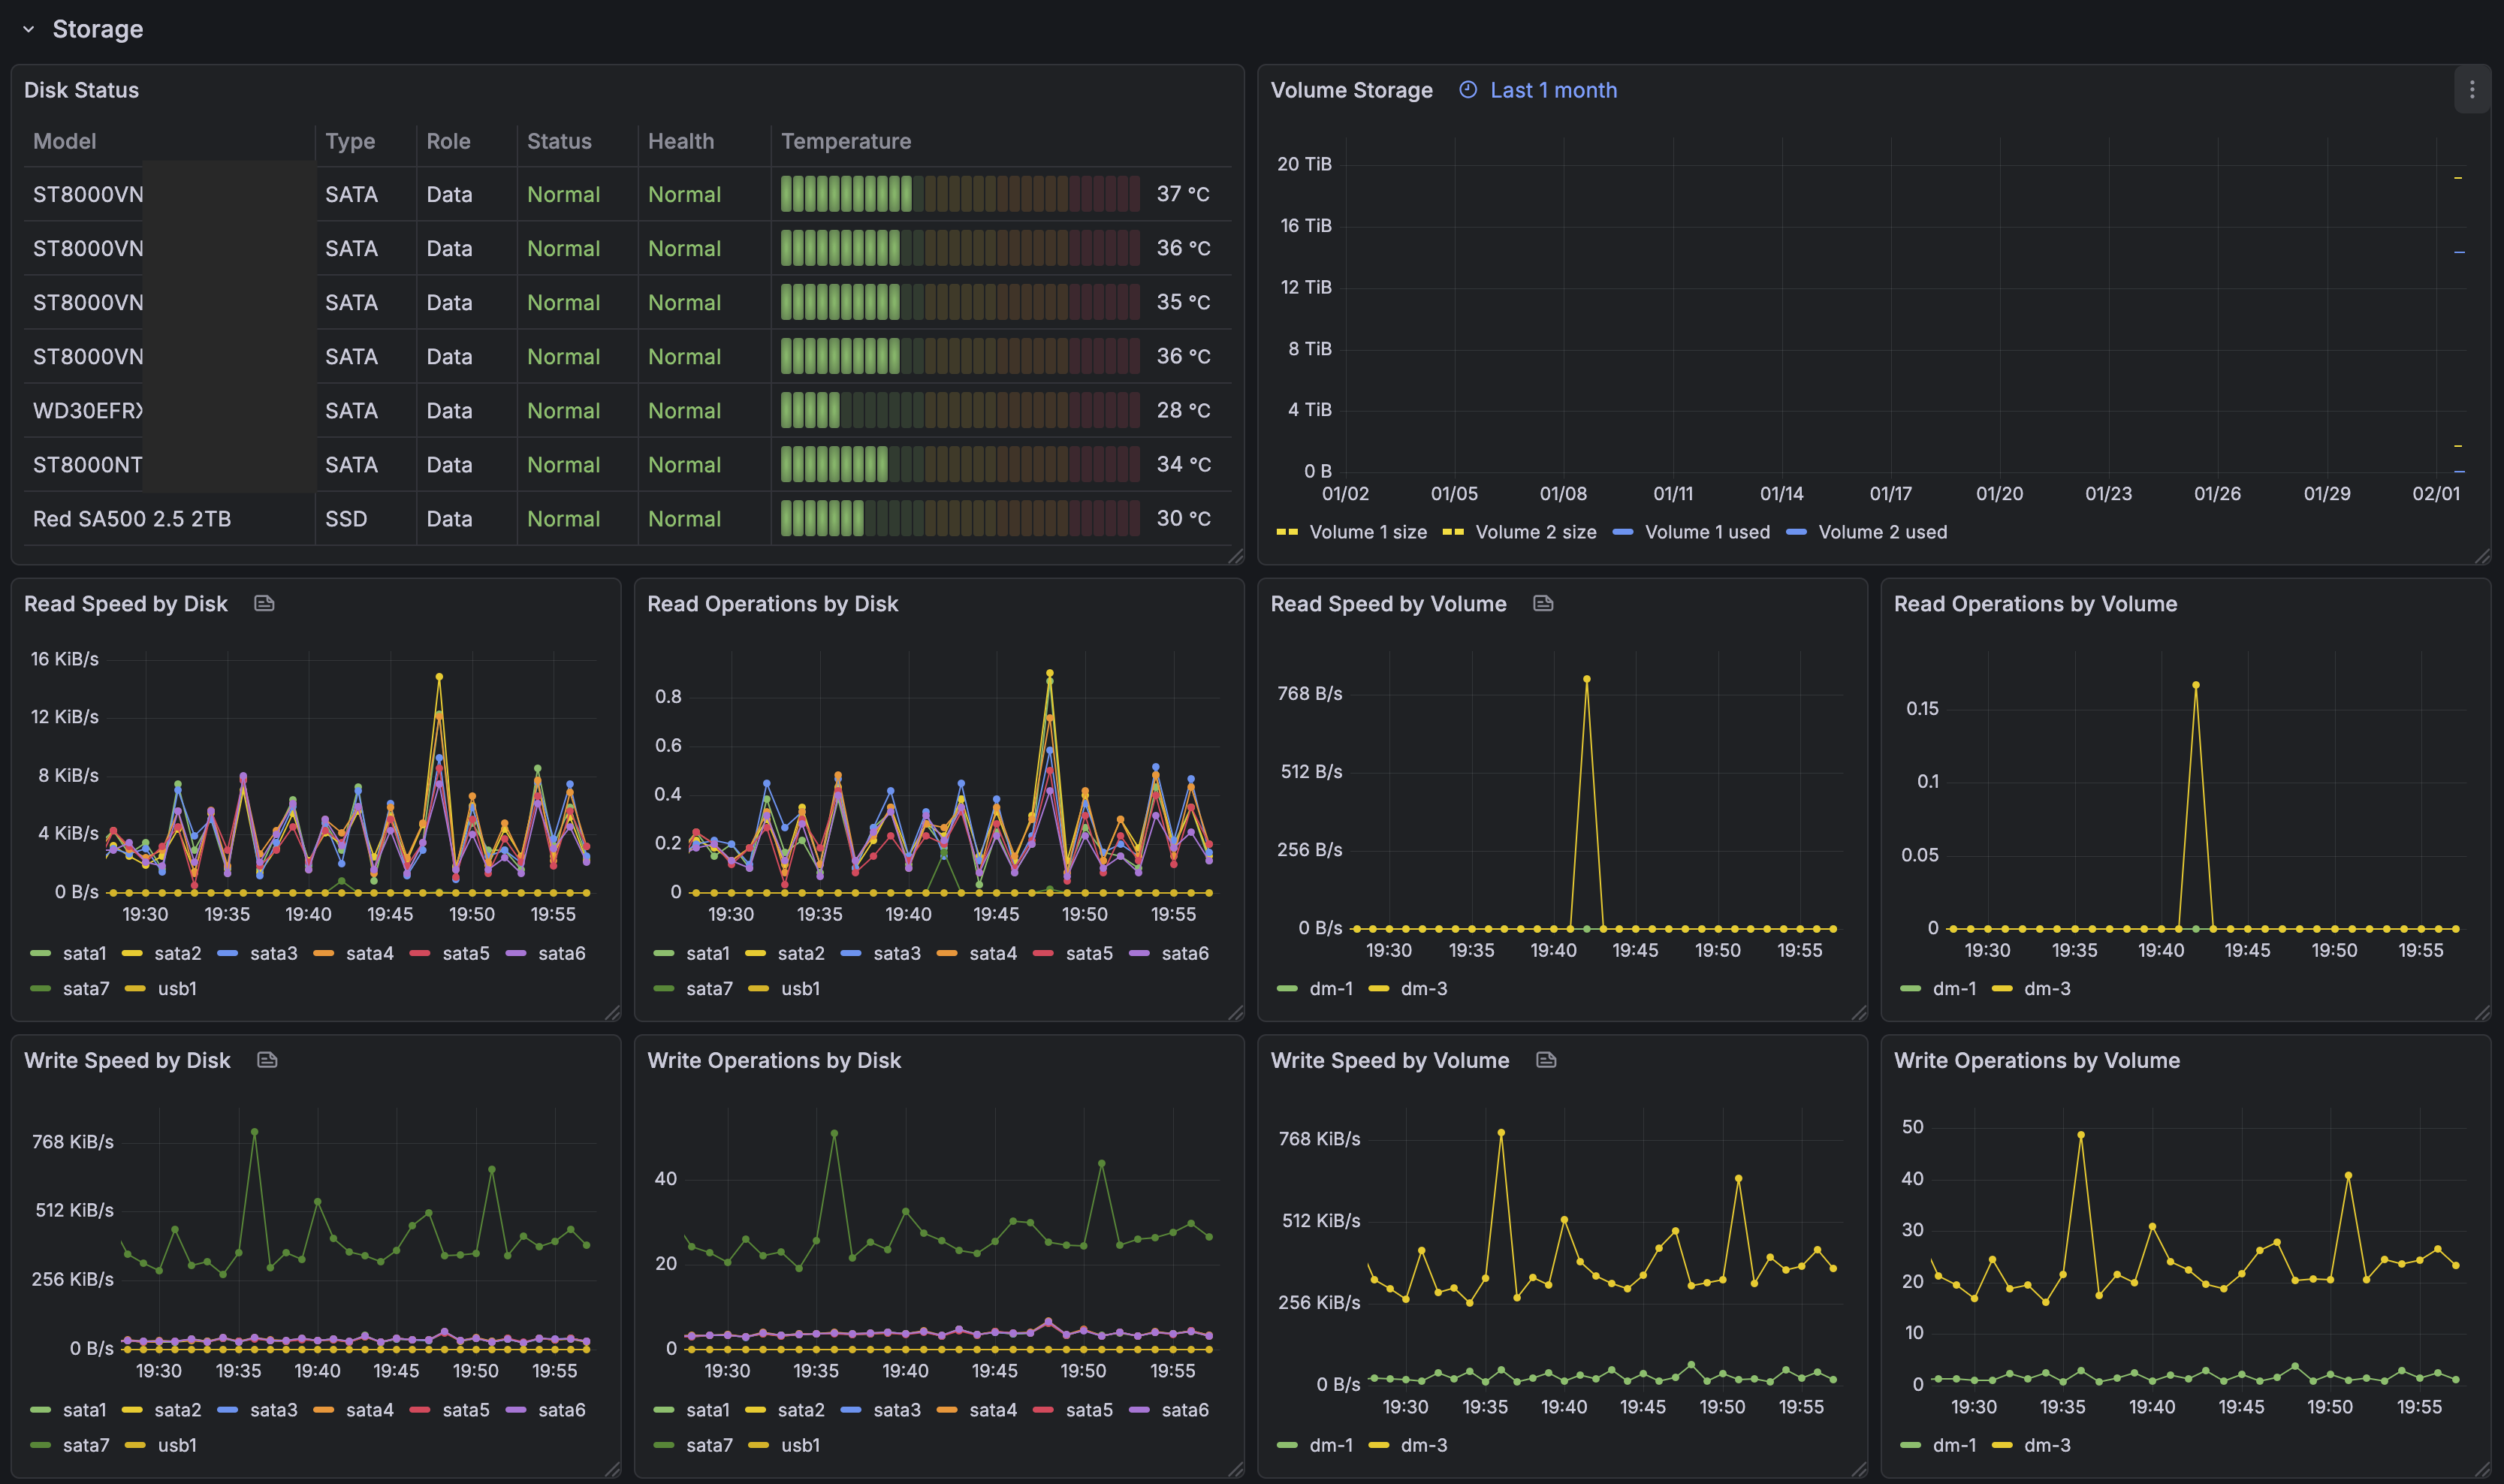
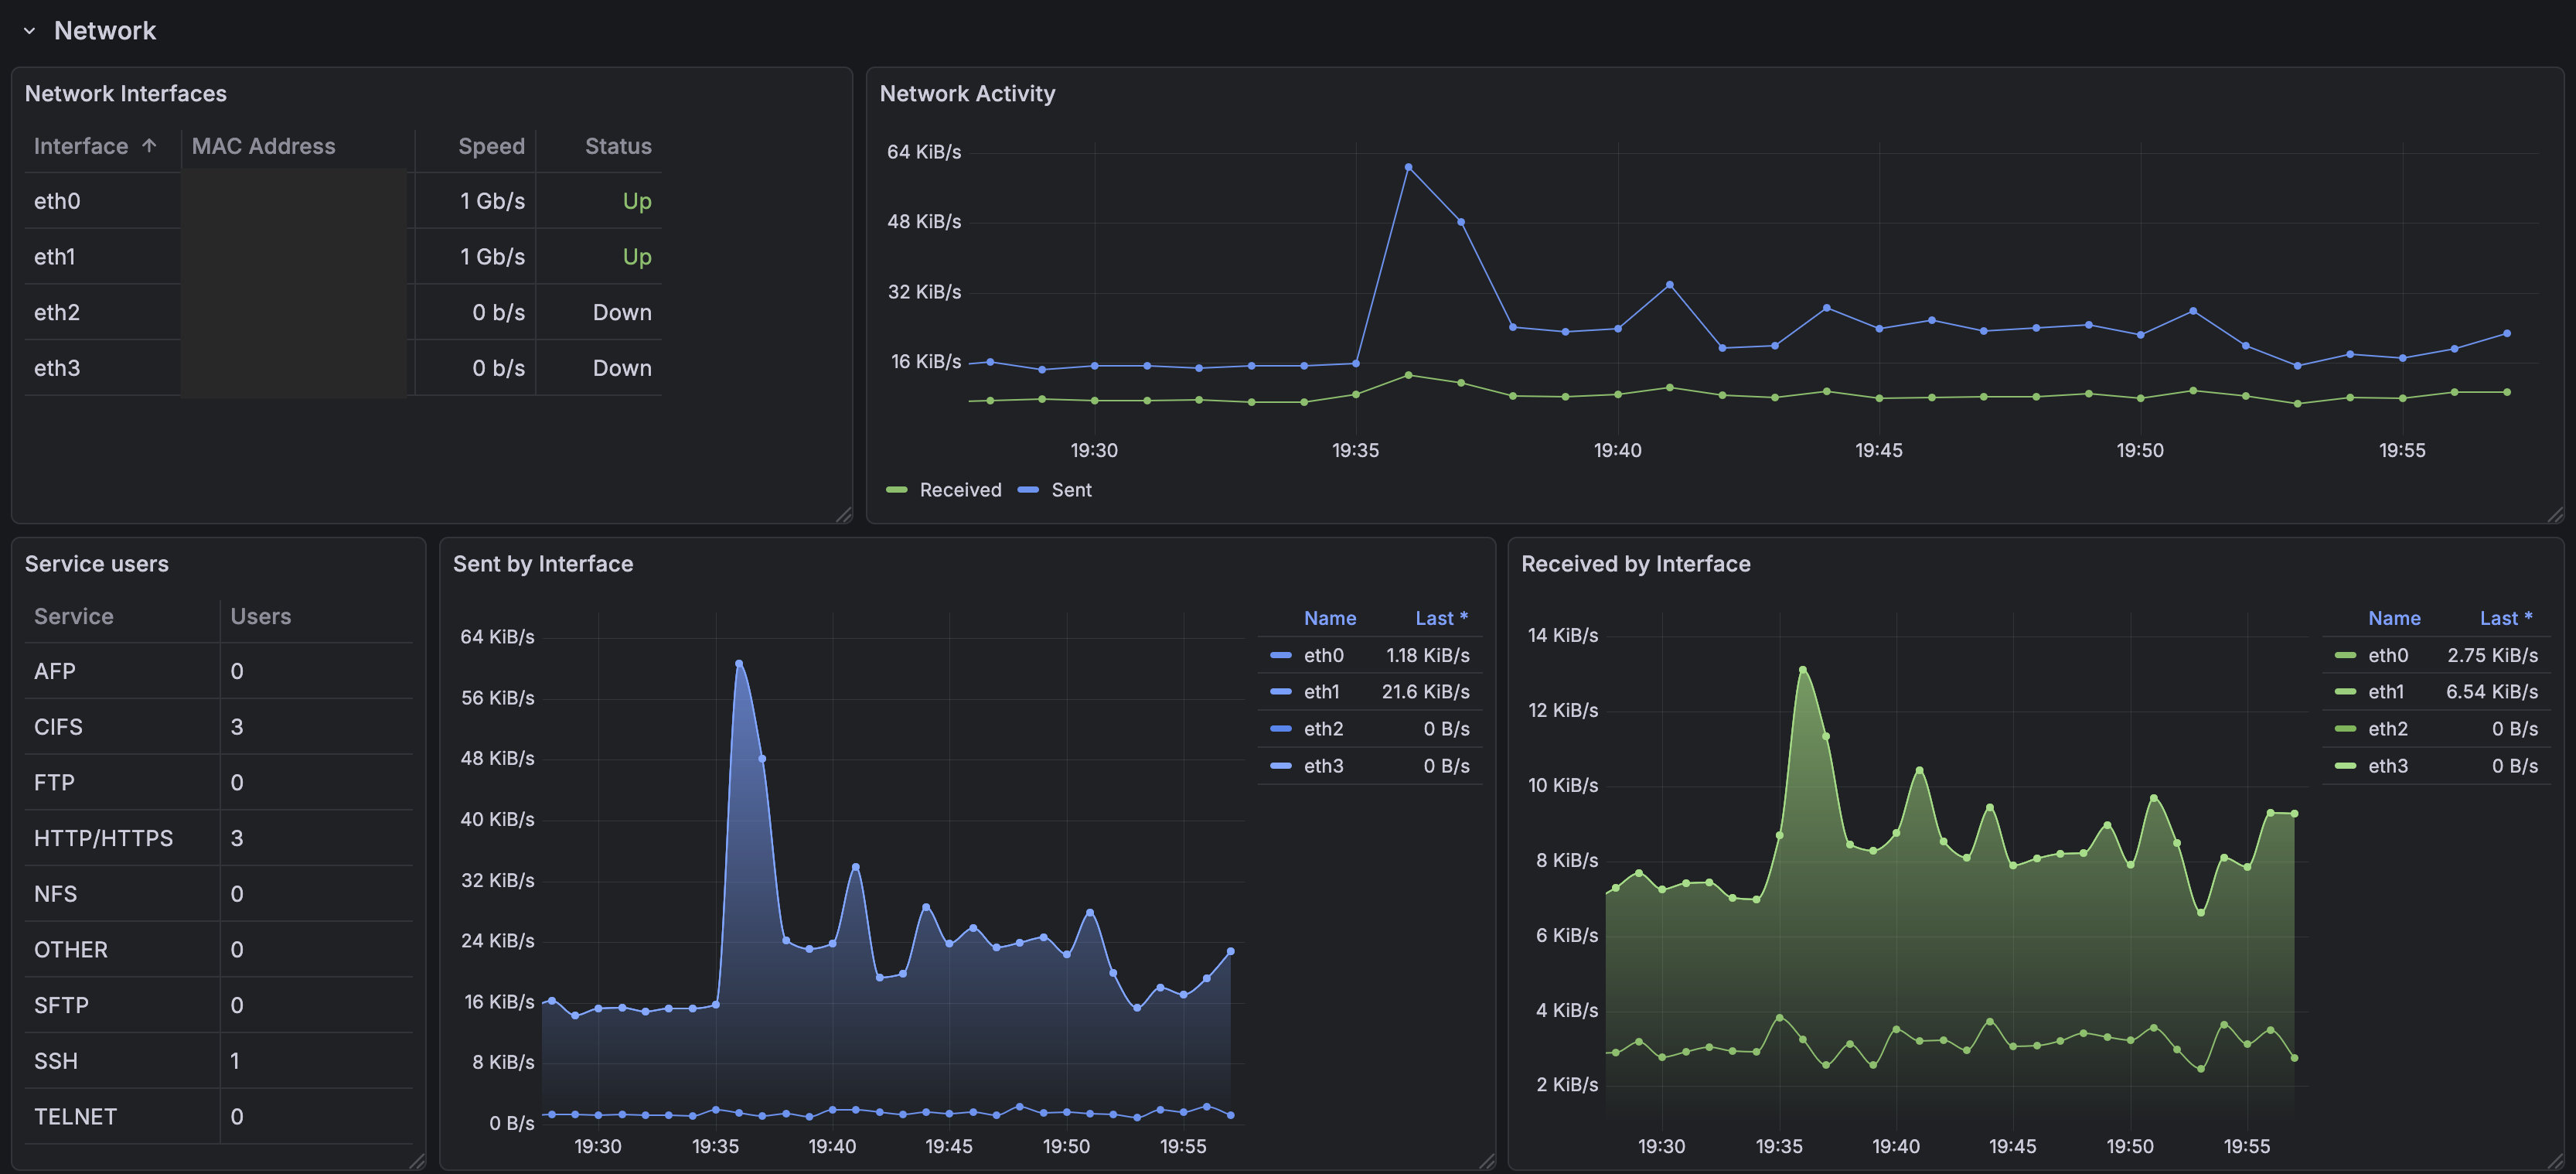
Dashboard example
Below are some examples of simple visualisations you can create. If you don't want to build the whole dashboard from scratch, check out some pre-made community dashboards.
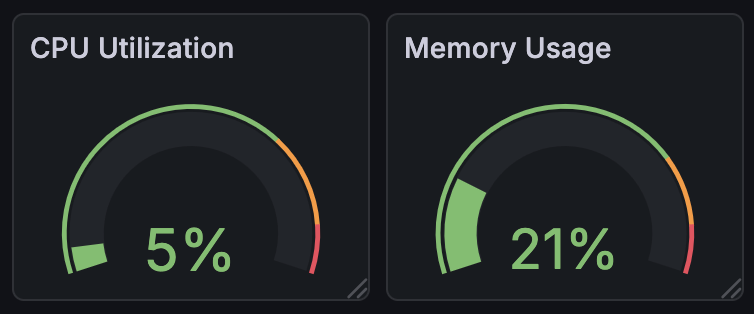
Create a couple of Gauge visualsations and use the following queries:
ssCpuSystem{job="synology"} + ssCpuUser{job="synology"}(memTotalReal{job="synology"} -
(
memCached{job="synology"} +
memBuffer{job="synology"} +
memAvailReal{job="synology"}
)
) / memTotalReal{job="synology"}